Grow Your Business With Data Visualization: Business Intelligence Dashboard
Did you know that small businesses make up 98% of businesses in Australia, and yet only half of them survive past the five-year mark? The statistics are staggering, but it’s not surprising when you consider how challenging it is to run a small business. Not only do you have to wear a lot of hats, but you also have to keep track of a million different moving parts. It’s no wonder that so many small businesses fail. But there is one tool that can help small businesses succeed: a Business Intelligence Dashboard.
Benefits Of a Business Intelligence Dashboards
Riding the wave of ever-growing technology has been the small businesses’ mantra for decades now. With the technological advancements surfacing each year, even small and medium-sized businesses are able to leverage certain aspects of these innovations in order to increase efficiency and keep pace with their respective industries or markets.
But with so much data to sift through, it can be difficult to know where to start. That’s where small business dashboards come in.
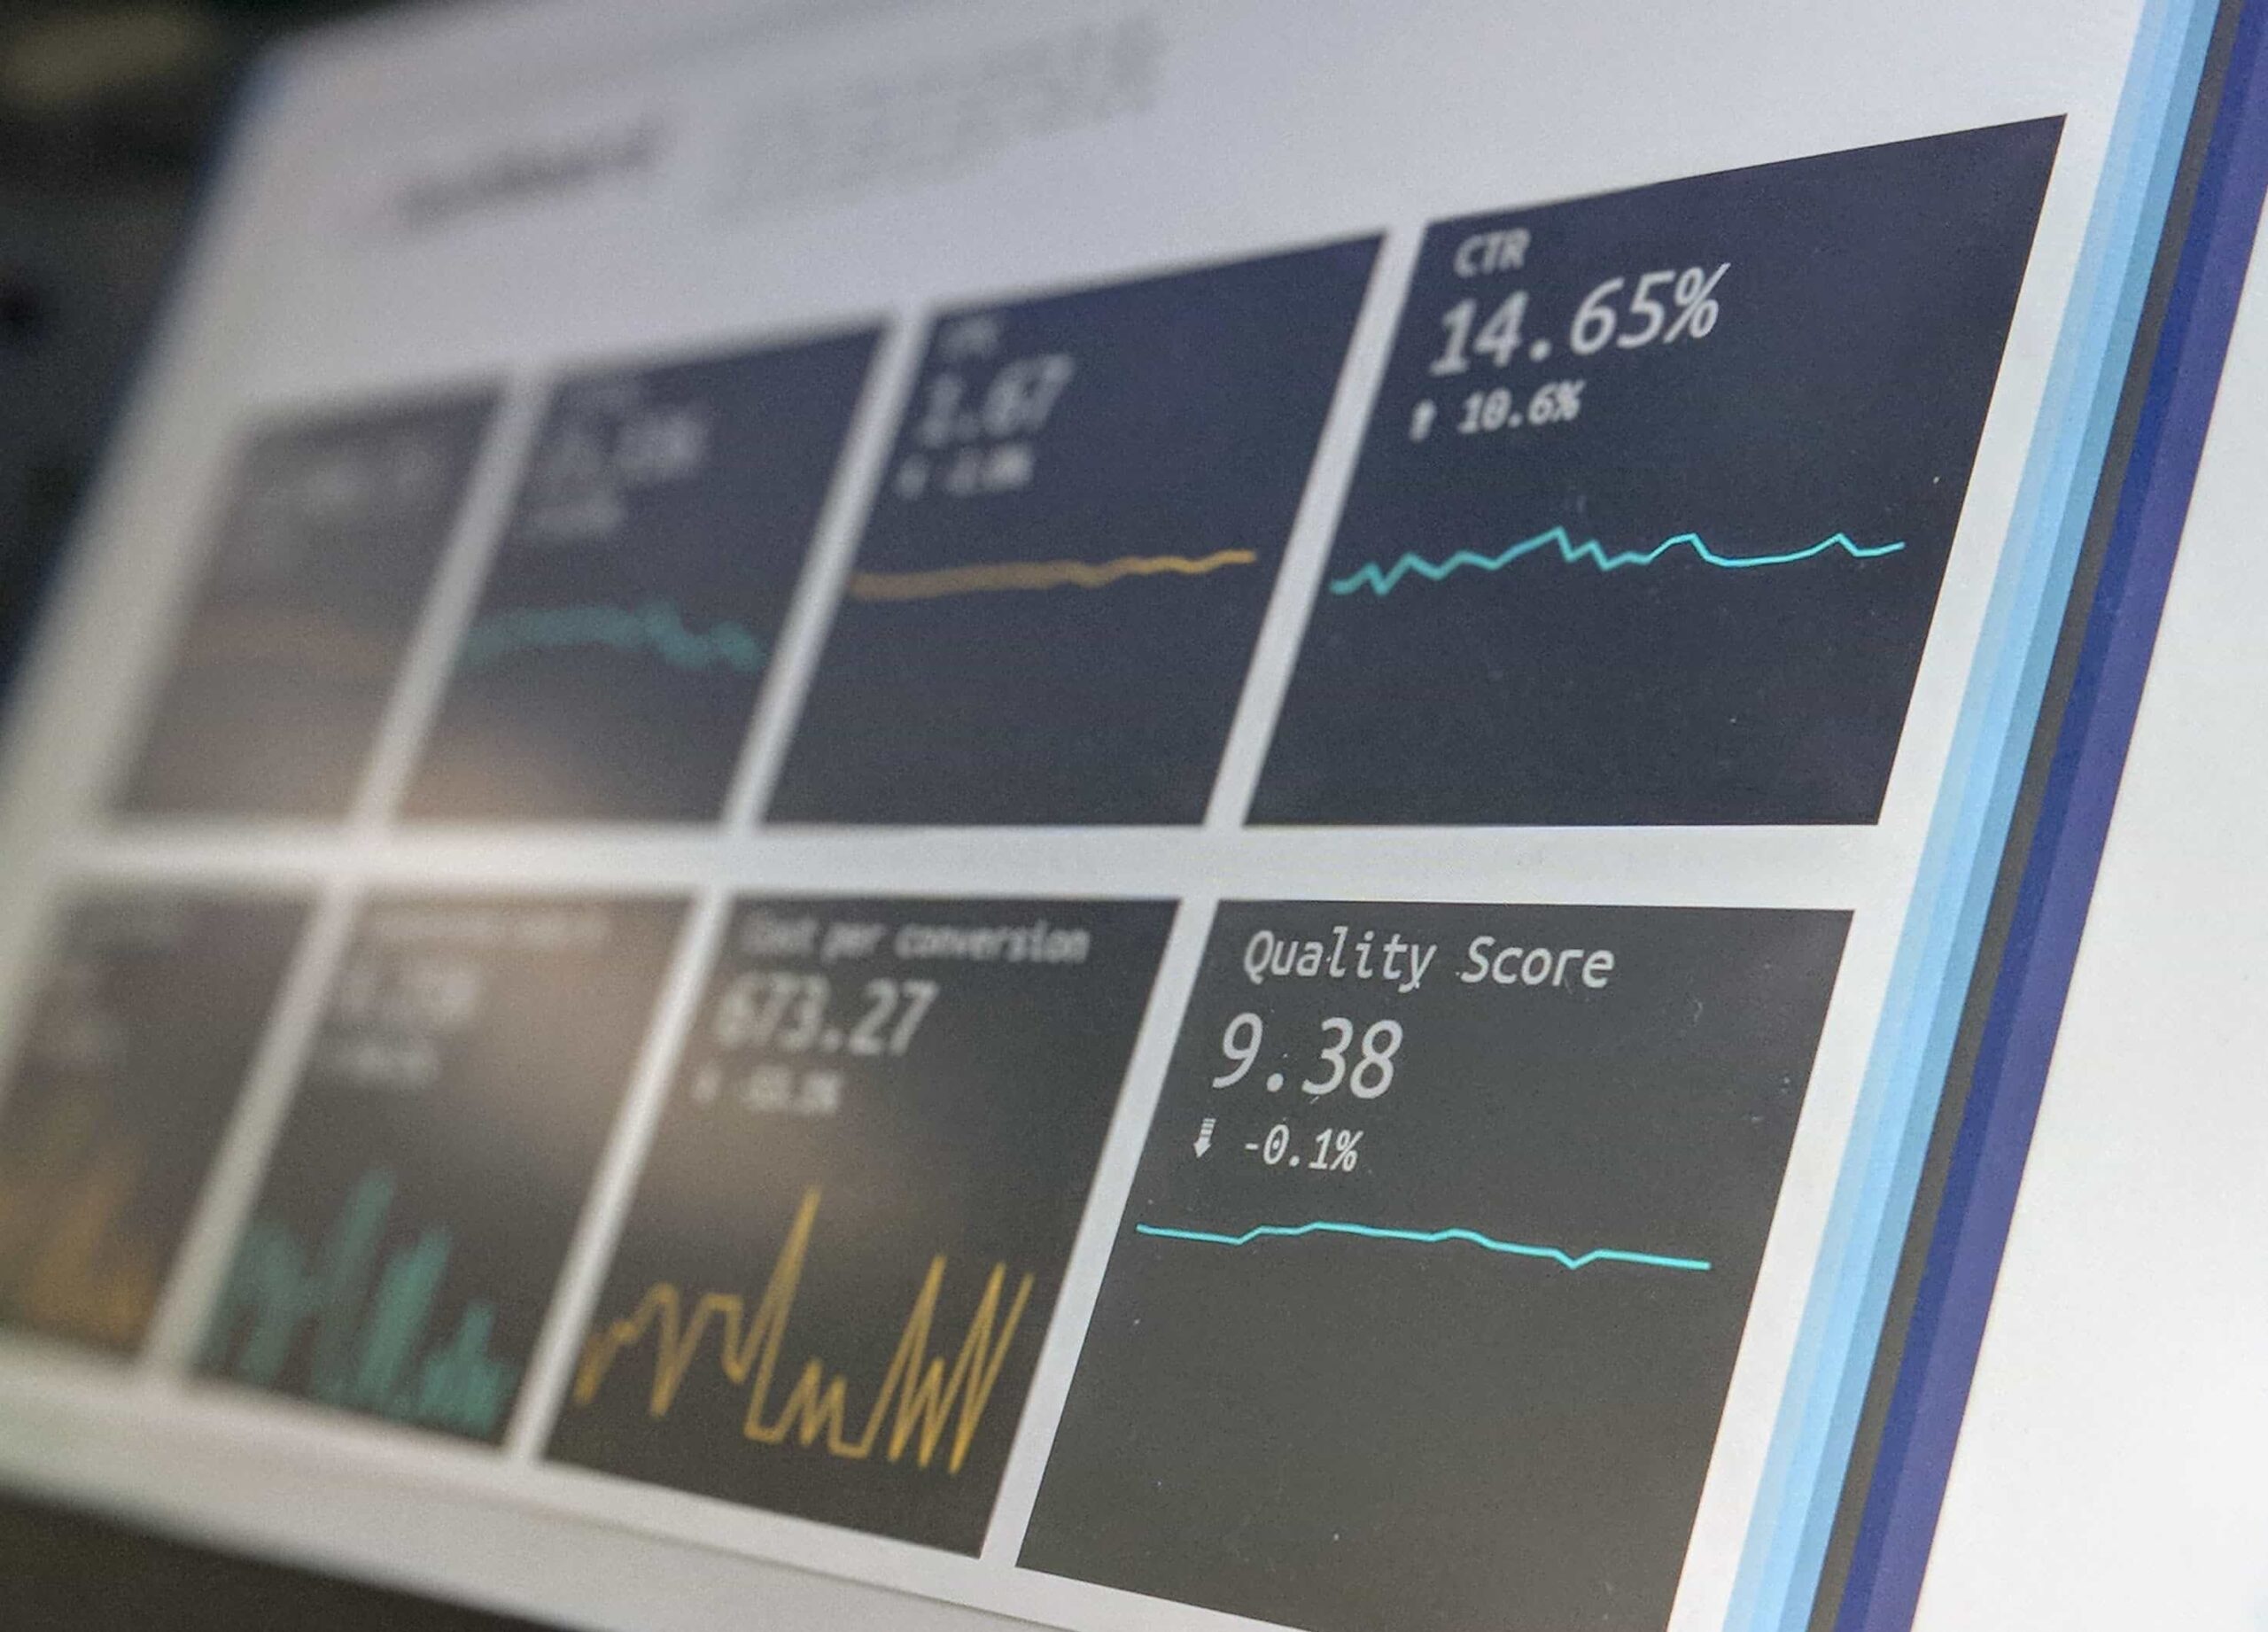
Never before have dashboards been so integral in the day-to-day running of a business. They allow you to track and compare your information and KPIs from multiple sources in one place, across one business visualization suite. Not to mention, they can offer a massive range of functions, from analysing active data and tracking key metrics in real time to helping with strategic and operational charts. Ask any CEO or business owner, and they will tell you that Business Intelligence Tools are central to the daily running of their business.
Business Intelligence Report Automation
Our dashboards are designed to be easy-to-use and informative. With custom dashboard layouts and an easy-to-use editor, our dashboards are an essential tool that informs and aligns, providing you and your colleagues a visual analysis of data.
Unlike an off-the-shelf product, our custom business software allows you to choose what information is key to you and your business. Whether it be presenting business performance reporting or data analysis, Fourth Dimension editable dashboards enable every department to benefit from having information at their fingertips.
Dashboards can offer a huge range of functions from analyzing active data and tracking key metrics in real-time to helping with strategic operational charts.
Give your employees the ability to focus on particular tasks or work towards the bigger picture. Put your business needs at their fingertips. Accessible to any staff member you wish, we have created numerous templates to draw down on, all of which are editable and allow for handpicked data reviewing. Undoubtedly using our reporting dashboards will change how you and your company utilize your data and lead to a more meaningful understanding of your business.
Centralized
Our Dashboards are essential to the performance and success of your business. Our platform allows you to see all of your data in one place, in real time. With 4D Dashboards, view charts, graphs, KPIs and much more on one clean platform and all in one place.
What is the key objective of data analysis?
4D’s business Dashboards are easy to build and edit, allowing you to put your needs front and centre in an easy-to-understand and meaningful way.
Each metric tells a story and is intimately woven into the fabric of your firm. Help teams focus on strategy, plan, execute and evaluate projects, define and track KPIs, and more. Host events and decision-making sessions using bespoke Dashboard reporting. Make intelligent business decisions by drilling down on points of interest and identifying weak spots and strengths in seconds. Tell a story, go back in time to measure the growth and successes of relevant historical data, and compare years of data at the click of a button. Indulge and analyse your business using our stunning, visual Dashboards.
Business Intelligence KPI To Satisfy Individual Needs
Each business will have bespoke requirements from their Dashboard reporting, and within the business, each individual department and each individual person will also have specific data analysis needs. With our customizable Dashboards, each requirement can be met, and each particular question can be answered via tracking and analysis of data and KPIs with almost limitless options.
Data Analysis & Decision Making
The way you make business decisions will be changed forever. We live in a 24-hour, ever-changing society. Evidently, with information reported globally in seconds, the data in front of you can quickly become outdated. Never again rely upon outdated information to benchmark your decisions against. The real-time nature of our Dashboards means that your data is displayed as continuously moving and updated. Thus, users can choose to review their Dashboard reporting constantly all day or check in as required on an hourly, daily or weekly basis.
4D offers easy access and sharing of all the metrics to understand the running of your business. It reacts to events that occur and changes the course of your marketplace. Allow your team leaders and department heads to manage their teams effectively and efficiently based on live data. Finally, the era of lengthy, face-to-face meetings is fast approaching its end date, with the decision-making process made simple and secure via cloud BI. Furthermore, drive collaboration, efficiency and key-productivity metrics with accurate data and ensure your business is in safe, future-proof hands with our best-in-class software. Empower your team to predict future trends, foresee future opportunities and grow your business with the 4D decision support tools.
Protecting Your Business
Permission to view and edit each Dashboard can be controlled, locked and encrypted as required. Using the role, department and executive level access will keep sensitive data in front of the right people.
Customise your visual reporting with our editable Dashboards. Amend colours, fonts, and sizes and change data orders with an almost infinite set of options. Your dashboards can be shared with ease both internally and externally via secure URLs, allowing recipients to understand your information with our wide range of interactive choices that make data exploration fun and exciting.
Benefits of 4D Dashboards
Dashboards are a fast, easy way to break down multiple data points and promote thought and collaboration via visual stimulation. As with the entire suite of BI tools from 4D, you can benefit from our pre-set data analysis plan templates or create your own to track the information you can’t do without. Improve communication, increase collaboration, and thus modernize how your teams track and respond to data via our Dashboards.
Just visualize starting your day with a timely overview of key metrics that matter to you. Not to mention, it can all be viewed via our engaging Dashboard. Ensure your business is performing as expected in seconds. Without our Dashboards, your data may be stored across multiple platforms, taking hours to view and analyse. However, we make the big picture viewable in seconds. You can grasp important information quickly and review your business needs ad hoc, all with information you can rely on. 4D has made data flow analysis tracking easy. Let our data analysis tools replace excel, promote growth, and give you valuable time back to spend elsewhere. Daily, weekly, or monthly tasks and KPIs can be visualised in seconds and understood just as quickly. You’ll appreciate the daily running of your business like never before.
Getting Started with Your Dashboard
If you’re looking for a way to streamline your workflow and get more done in less time, consider signing up for a free trial of our service.
Here’s how it works: first, click on the free trial link on our website. Then, create an account using your email address and a password of your choice. Once you’ve registered, you can input your payment information (optional) or choose to continue with the no-credit card option.
That’s it! You’re now ready to start using our service to its full potential. If you have any questions or need help getting started, feel free to reach out to our support team.
Frequently Asked Questions
Business intelligence dashboards are a popular way for organizations to track key performance indicators and make data-driven decisions. However, there are a few common questions that people have about business intelligence (BI) dashboards. Here are some of the most frequently asked questions:Business intelligence dashboards are visual tools that help business users track, measure, and understand key performance indicators (KPIs) and other data points. Dashboards consolidate information from multiple data sources into a single, easy-to-understand interface. This allows users to quickly see how their business is performing and identify areas that need improvement.
Dashboards can help you save time by providing quick, easy access to the information you need at a glance. By standardizing business reporting, dashboards can help you quickly identify trends and patterns. Analytical dashboards can also improve communication by providing transparency across your organization. By making it easy to see information at a glance, dashboards can help save you time and improve your decision making.
The best way to create a BI dashboard depends on the specific needs of the business. Start by identifying the KPIs that you want to track. Once you have identified the KPIs, gather the data that you need to populate the dashboard. Once you have the data, choose a visualization tool to create the actual dashboard. There are many different SAAS BI tools available, so make sure to choose one that meets all of your business needs.
BI dashboards are important because they help users make better decisions by bringing together data from multiple sources into one convenient location. Dashboards also make it easy to spot trends and patterns that would be difficult to see if the data was presented in a more traditional format.
There are many reasons why you would use a BI Dashboard. Some common reasons include: To track progress over time; To compare different data sets side-by-side; To quickly spot trends; To identify areas needing improvement; To share information with others in an easily digestible format.
Yes, we offer a comprehensive 14-day free trial and will get you up and running instantaneously. Simply click, enter your details and see what our BI tools can offer you
Our prices vary depending on the number of users. Purchasing users in batches of 100 is the most cost-effective way to use our service. 100 users cost $100. That’s just $1 per user per month! This system gives you the flexibility to scale your business as needed, without having to worry about a big jump in price all at once.
Cancellation is never difficult with our no-risk policy. You can cancel anytime and with no penalty.
There are none. All features are available to all users at all times, without restriction. We don’t limit the number of items, or bandwidth – once you have purchased your subscription with the chosen amount of users, the application is yours to use as you wish.
We take security seriously, which is why 4D is centered on Microsoft SQL Server. Our recommended process is to use 4D as a Data Warehouse and import your data to SQL. We can leverage the data security features of SQL to keep your access controlled and safe. Let 4D keep you safe and secure with our iron-clad security and permission processes.
Pricey BI tools handle big and complex data and come with big and complex pricing, at 4D we see things differently. Our product gives you all of the technical abilities of larger-scale products for a fraction of the price. Plus, our team of business intelligence developers and consultants are always available to help you get the most out of your data.
Don’t Waste a Second
There’s no denying that big data is becoming more and more important in today’s business landscape. But as data sets grow larger and more complex, traditional tools are struggling to keep up.
Our ground-breaking product is designed to handle big and complex data sets, without the hefty price tag. We know that the landscape of business intelligence is always changing, which is why we’re constantly innovating and evolving our offerings to make sure that we’re always at the forefront of the latest developments. This commitment to excellence is what sets us apart from the rest.
Start your free 14-day trial now and learn what our business intelligence tools can do for you. Once you experience firsthand the game-changing simplicity of our Dashboards, you won’t view raw data the same way again. Click below and get to work immediately.

Experience Smarter Business Intelligence
Sign up for a 14-day free trial