What is Data Visualisation? Importance, Methods & Tools
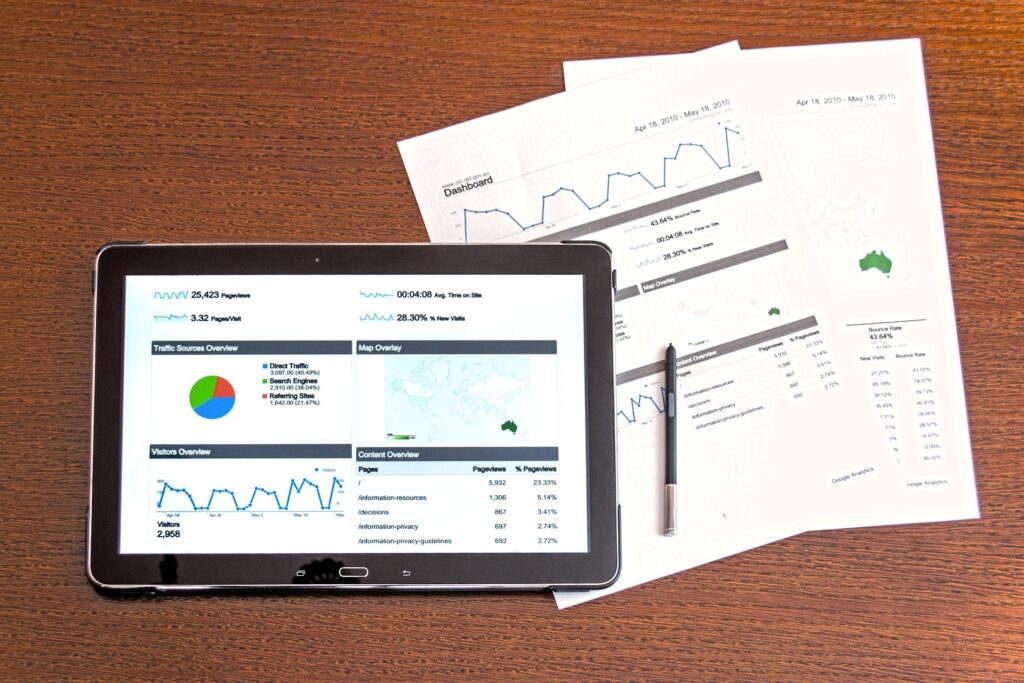
Data Visualisation is the graphical depiction of data using visual elements such as graphs, charts, and histograms. Its purpose is to provide accessible and easily understandable insights into statistical figures, thus allowing for the identification of patterns, trends, and outliers in extensive data sets to aid in data-driven decisions. In other words, a large […]