
Data is today’s oil. It is the fuel for tomorrow’s economy and will continue to grow in significance in all industries. In fact, data and its analysis are now critical success factors for businesses of any size or sector. Read on to learn more about data analysis.
Contents
What is Data Analysis?
Why is Data Analysis Important?
Data Analysis Process

First Things First — What Exactly is Data Analysis?
Data analysis is a process of inspecting, cleansing, transforming and modelling data to discover useful information, suggest conclusions and support decision-making. Data analytics can also identify trends, correlations and patterns among data sets.
There are a variety of data analysis tools available in the market today. Some of these tools are free, while others are available for purchase. The type of tool you choose will depend on your business needs and budget.
Some Typical Data Analysis Tools Include:
- Excel: A spreadsheet application for various data analysis tasks including sorting, filtering and calculating data.
- Tableau: Tableau is a data visualisation tool that can create interactive charts and graphs.
- SPSS: A statistical analysis tool that calculates correlations, performs regression analysis and creates predictive models.
- R: R is a data analysis and statistical computing programming language.
How to Find The Best Data Analysis Tools to Process and Interpret Data
When choosing a data analysis tool, it is crucial to consider your specific needs and objectives. There are several factors you should take into account, such as the type of data you want to analyse, the size of your data set, the level of complexity you need and your budget.
Once you have selected a data analysis tool, the next step is to process and interpret your data using various methods. These include statistical analysis, machine learning or data mining.
Statistical analysis is a method of analysing data sets in order to identify trends and patterns. It determines whether two variables correlate, predicts future events, or estimates the probability of specific outcomes.
Machine learning is a type of artificial intelligence that processes and interprets data. This method can build models that make predictions based on data sets.
Data mining is a process of extracting valuable information from large data sets. This method can find trends, correlations and patterns among data sets.
After you have processed and interpreted your data, the next step is to make decisions based on your findings. This is where data analytics comes in. Data analytics turns data into insights to make informed decisions.
The Importance of Data Analysis
Data analysis is an essential part of any business. By analysing data, you can make informed decisions about your business and how to improve it. There are many potential uses for data analysis, including market research, product development, and performance review. However, you may wonder why such a detailed review of numbers matters so much to your business. Here are five reasons why data analysis is so important to your company.
It Allows You to Predict the Behaviour of Your Audience
Analysing data and making conclusions is a great way to predict how your audience will act in certain situations. By reviewing usage data such as click-through rates or customer service calls, you can discover what your customers are looking for and how they want to interact with your brand. This information creates strategic business decisions, such as recommending products or services to specific customers based on their previous purchases. For example, let’s say you have a retail store and are concerned about sales of one of your products, such as a specific type of jacket. By examining customer data, you can see how often customers have searched for that jacket and which sizes and colours they have selected. Knowing this information allows you to predict how customers will interact with your store and what kind of marketing strategy will be most effective.
Reduce Costs
When you compare your expenses to those of competitors, you can see how much you save. This information proposes better marketing strategies. For example, suppose your company plans to spend $50,000 on advertising and $20,000 on promoting a product. In that case, you can determine how much money you will save by eliminating promotional costs and charging the same amount for all products.
Customer goals are one of the most important things to consider when planning your marketing strategy. It is always important to ask customers what they want from their products and services before they purchase them. Marketing managers should also ask customers about their long-term goals for the company and how they would like their organisation to look five years from now. If a customer is asking for a product that is not yet available or has been discontinued or unavailable due to some issue with manufacturing or distribution, it may be worth considering replacing that product with something new.
This information can help determine whether or not the business will be able to meet customer needs in the future by using this information early on in the buying process. You should also consider knowing the specific dates people will need your product so that if someone is still interested but no longer wants it, you have time to offer another replacement item instead of having to call customer service at once. Knowing these things early on in the buying process helps ensure that your business will be able to sell more products.
It Helps You Understand What is Currently Working and What Isn’t.
By reviewing past data, you can learn about what has worked for your business in the past and determine what strategies are no longer helpful. For example, if you are concerned about the effectiveness of your marketing campaign, reviewing data from past marketing efforts can help you understand which strategies were successful.
By understanding what has worked in the past, you also have a better idea of what will work in the future. For example, if you notice that an email marketing campaign is more successful than a social media strategy, you can plan to utilise email marketing again in the future. This process also determines which strategies aren’t working anymore and are replaceable. For example, if one of your marketing strategies isn’t generating the same amount of traffic or sales as it used to, you can replace it with a different and more effective strategy.
It’s a Way to Measure Your Progress Over Time.
A significant advantage of data analysis is that it allows you to track trends over time, giving insights into how your business has grown or declined. This is a critical aspect of data analysis for businesses operating in an industry with high competition. By tracking how your business changes over time, you can determine what aspects of your business have improved or declined so that you can make decisions based on this information. For example, let’s say you run a restaurant in a popular tourist area. If you notice that the amount of money you make from customers who pay with credit cards has decreased over time, but the amount paid with cash has increased, you can use this information to make a strategic decision about how to address the issue.
Utilise Ad Hoc Data to Make Decisions on New Strategies or Products.
One of the many ways you can use data analysis is to determine which new strategies or products will be most beneficial for your business. For example, you may consider introducing a new product to your lineup or adding a new marketing strategy to your business. By analysing data to determine what customers want or need, you can better understand which new strategies will be most effective for your company.
For example, let’s say you have a bakery shop and are considering adding muffins to your menu. To decide if it is worth adding muffins to your menu, you can examine data about muffin sales at other shops to see if it is worth the time and effort. By analysing data about muffin sales at other shops, you can determine if muffins will be worth the time and effort for you or if other items would be a better addition to your menu.
Section Concluding Remarks
Data analysis is an integral part of any business. It allows you to understand customer trends, predict future actions, and track progress over time. It can also help with decision-making on new strategies or products, and it’s a way to measure your progress over time. Data analysis is an essential part of a business with many uses, and it’s important to take the time to do it right.
The Data Analysis Process Explained
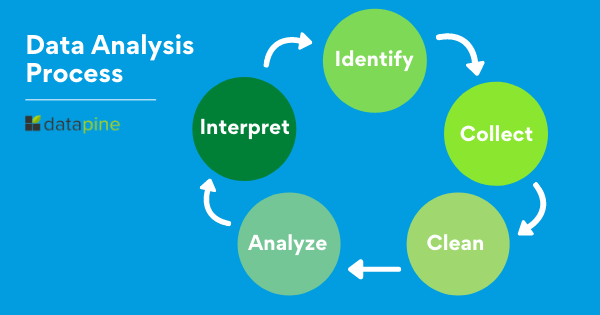
Define The Objective of Data Analysis
Data analysis is the process of extracting insights from data. It explores data to find patterns, Trends, and anomalies, identifying questions that can be answered with data, and visualising data so users understand it easily. Data analysis has many methods and tools for analysing data. These tools include spreadsheets, databases, statistical software programs and more advanced Big Data analytics packages such as Hadoop, Spark and SAS. Each of these tools has a specific purpose. This blog post covers the fundamental steps in the process of analysing data.
Collect and Import Data
The next step is to collect and import the data you’ll be analysing. This step is essential as the quality and type of data you start with is critical to the success of the analysis. Depending on what kind of data you need to analyse, you can collect it in different ways.
Data can be collected through surveys, online forms, or manually entered into spreadsheets or databases. You can also import existing data from databases or spreadsheets. Depending on the type of data you’re collecting, you may want to consider using software to make the data collection process more manageable. For example, survey software can help you create a custom survey and collect the data.
Data Cleaning
Once you’ve collected and imported the data, you’ll want to clean it. Cleaning data is organising and removing unnecessary information that might skew the results. Typically, the less clean your data is, the less useful your analysis will be. That’s because data cleaning removes anomalies and smoothes out trends. For example, if you’re analysing sales data and notice a product is being overcharged, data cleaning will remove that mistake so that you’re only looking at the correct numbers. Data cleaning occurs manually or with software. Manual data cleaning often involves deleting duplicate entries, correcting spelling errors, and organising columns of data. Data cleaning can also involve more advanced techniques, such as removing outliers (data points that are significantly higher or lower than the rest), filtering data based on conditions, and renaming columns.
Analyse
After you’ve collected and cleaned the data, it’s time to analyse it. There are many methods and tools that you can use to analyse data, depending on the type you have. There are also many different types of data you can analyse. For example, if you collected survey data, you can use data analysis methods such as trend, regression, and cluster analysis to explore the data and identify patterns. If you collect transactional data, you can use descriptive statistics, inferential statistics, and visualisation methods to analyse the data. Depending on the data you’re working with, you may have multiple ways of interpreting it. For example, if you’re analysing transactional data, you can perform descriptive statistics to summarise and find trends in the data. Alternatively, you can perform inferential statistics to make predictions about the data based on what you’ve seen so far.
Interpret
Interpretation is the final step in the data analysis process. Here, the analysis results are translated into insights. Interpretation is the step many people skip, but it’s essential to the success of the data analysis process. If you don’t interpret the results of your data analysis, they’re not worth anything to anyone. You can interpret data in a few different ways. You can create graphs or charts to visualise your data and then explain the trends you see. Alternatively, you can write a narrative (like a blog post) to explain the data and its trends. The third option is to create a data visualisation and describe what you see in the chart or graph.
Concluding Remarks
The last step in the data analysis process is to conclude the analysis. At this point, you should have insights that can help improve your business. However, they aren’t useful unless they’re communicated to the right people. To ensure the insights are used, communicate them to the right people in your organisation. You can do this by creating a presentation or report that summarises the data analysis and its results. You can also create a communication plan that includes who needs to know about the data analysis, how they need to know about it, and when they need to know.
See our blog on the Ultimate Contemporary Guide to Data Analysis for SMEs for information on how to turn your newfound knowledge into action!