What are business dashboards and how do they make your life so much easier? Here’s everything you need to know.
Contents
Business Dashboards – What are they?
Benefits
Business Dashboard vs Business Reporting
Utility
Types
Tools
So, What is a Business Dashboard?
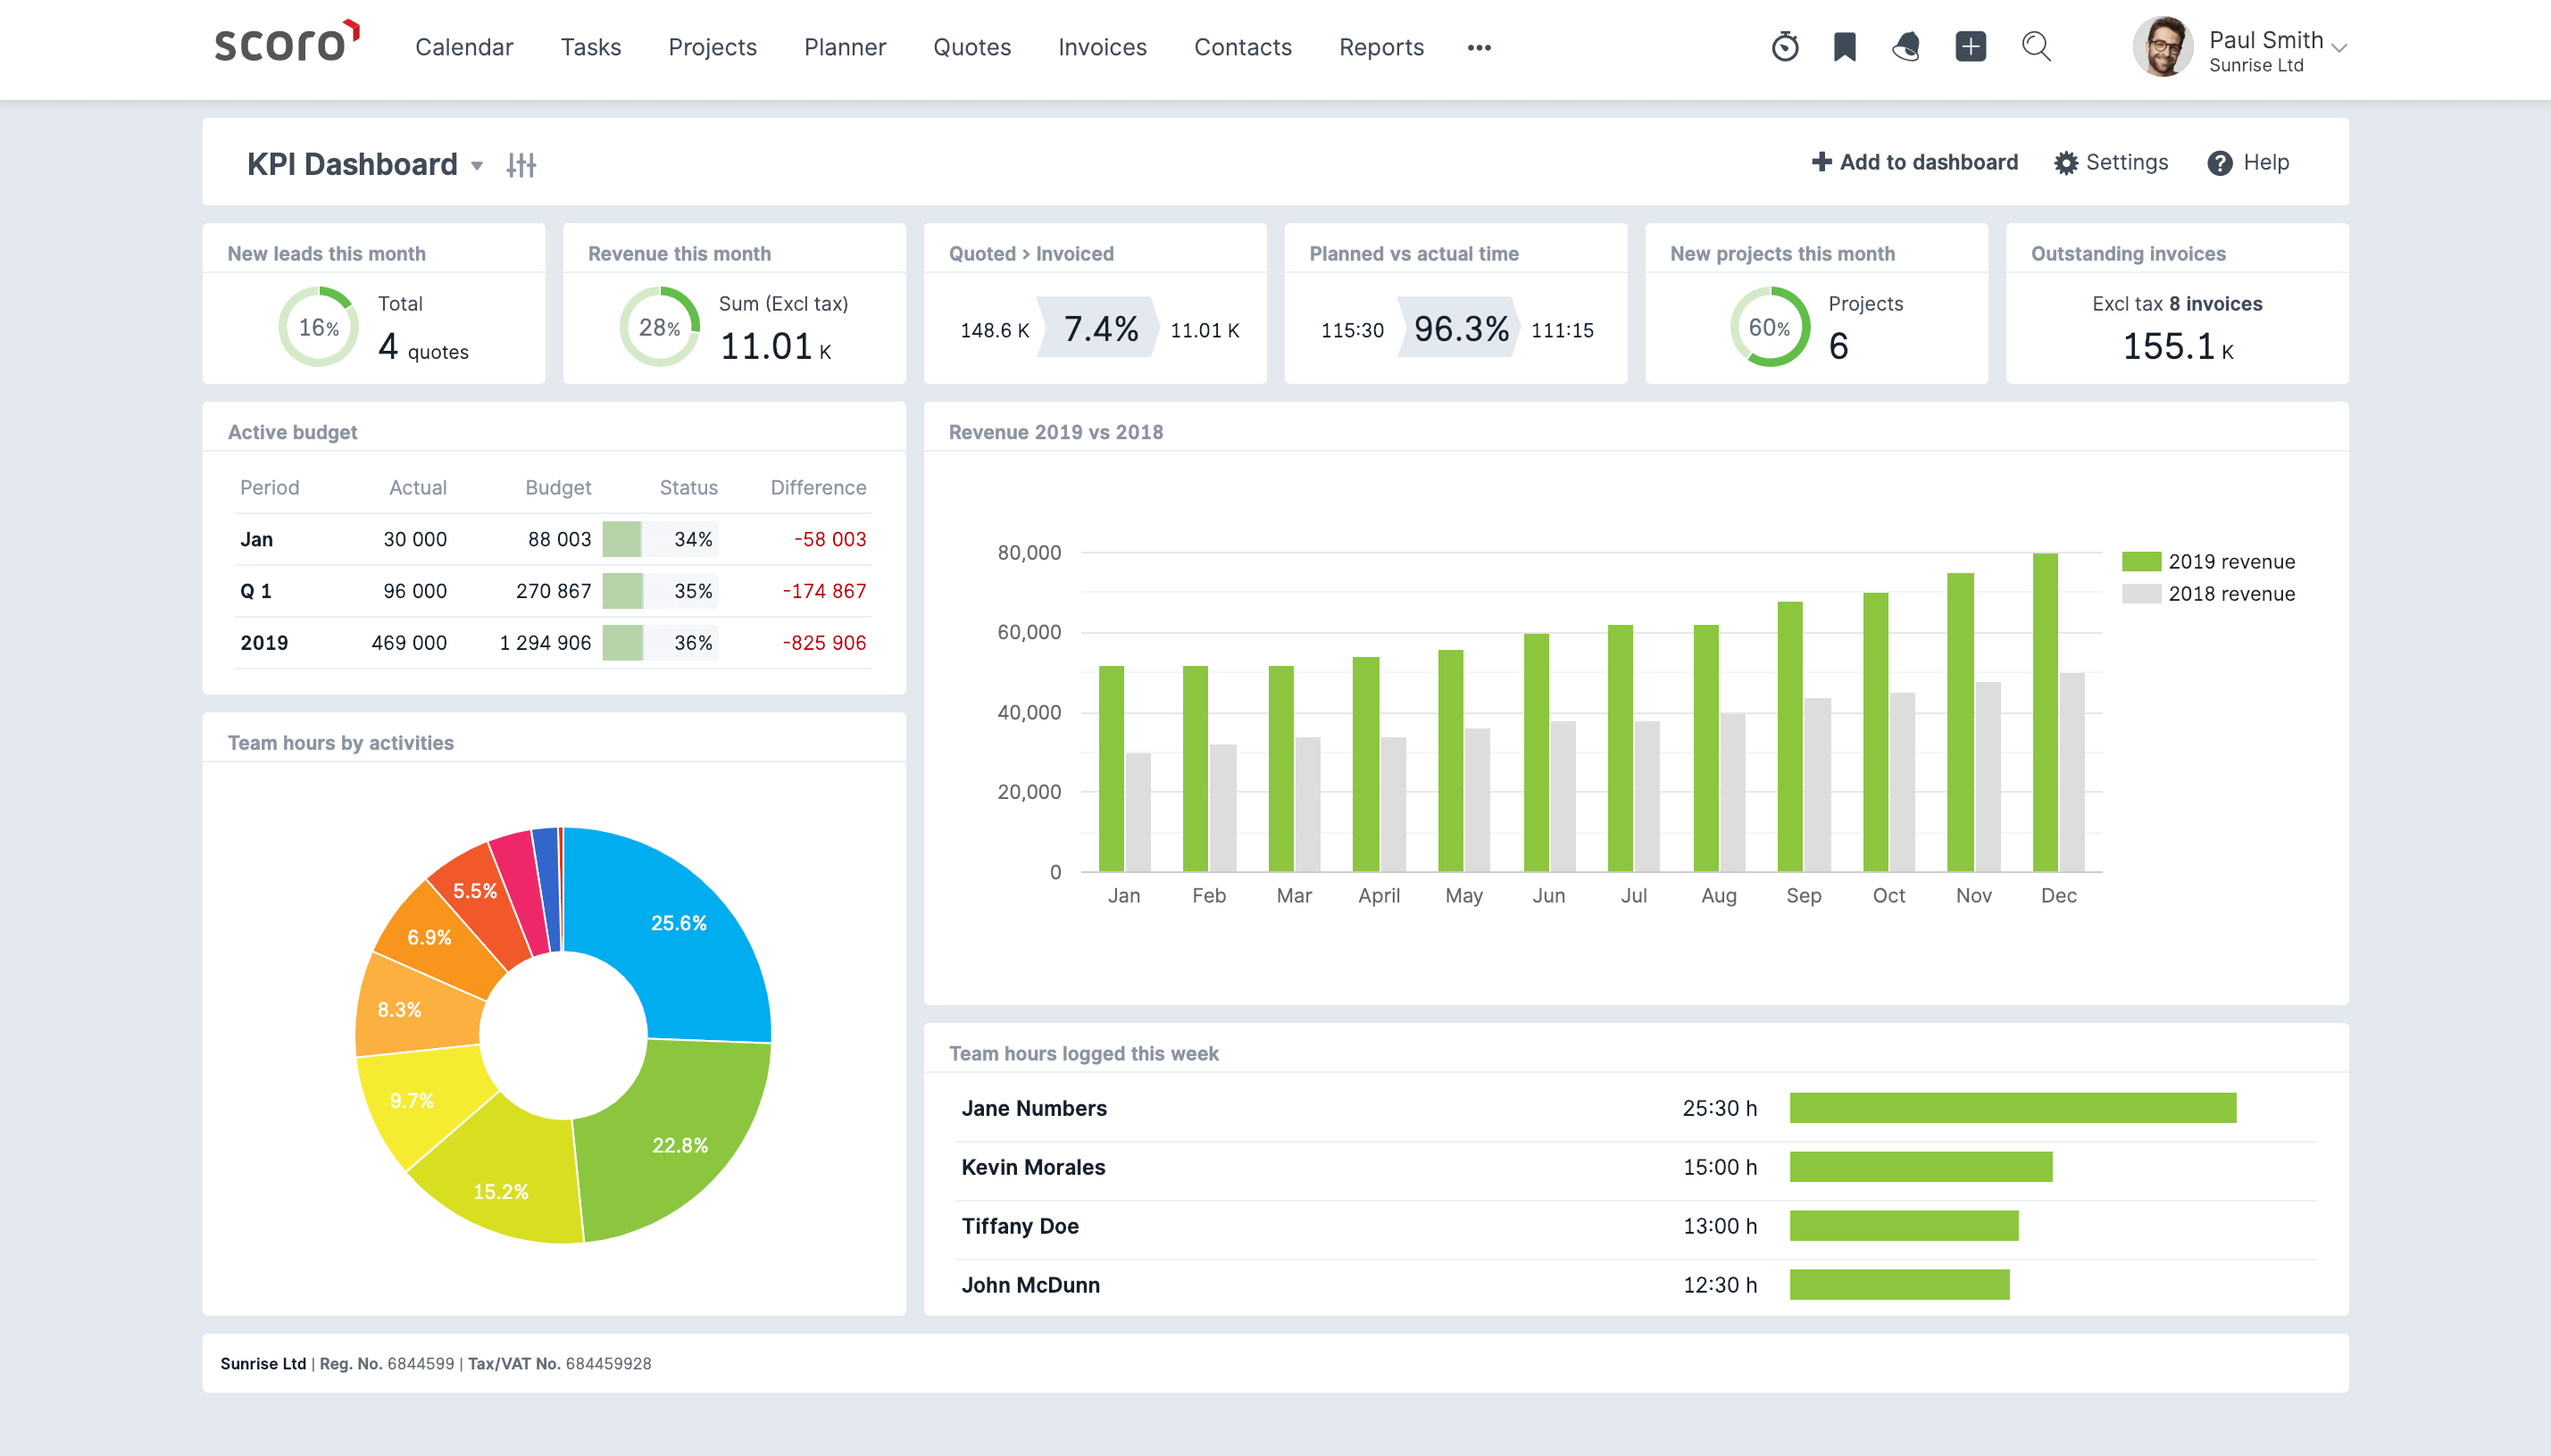
A business dashboard is a collection of visualised data in which key performance indicators (KPIs) and metrics are viewed in an at-a-glance format using graphics elements such as graphs, charts and tables etc. They allow leaders to observe team progress, track performances and aids in decision-making by displaying complex information such as domains, objectives, or goals in an easily accessible manner. Each element is automatically updated in real time via various data sources such as databases, websites, and inventory systems.
To put it simply, imagine a car dashboard, where you have access to all the vital information in a single glance, such as speed, mileage, or any important alerts. Business dashboards are inspired by car dashboards, where all important information is displayed visually and can be viewed within seconds.
Business Dashboard Benefits
1. They Demonstrate the Value of Data
Data is one of the largest assets to your business. That is why business dashboards are necessary – because they are able to display your data in a way that is easily manageable, which grants you the ability to weaponise it to benefit your business. Business Dashboards can allow for a unified scheme across the entire team as goals can be set and measured consistently and efficiently. By doing this, viewers can determine whether or not such goals are being appropriately executed.
Business Dashboard Vs Business Reporting
A business report performs similarly by “presenting KPIs and metrics through data visualisation”. Its main purpose is to assist users in creating strategies to move forward depending on a review of their data. However, the primary difference between business dashboards and business reports is the frequency of data updating.
Whilst reports are static documents which present, submit and record-keep, dashboards are live tools where updates to oversee metrics occur periodically. They display information visually so that users can observe historical progress over time in a glance. The displayable data can be chosen directly by users depending upon what it is they are specifically looking for.
Why Do You Need a Business Dashboard?
A business dashboard consolidates the necessary data to supervise a project. They summarise key indicators to track progress by siphoning out background information. As such, an efficient dashboard will improve business performance. Here are just some of the many benefits:
Accessibility
The correct data in the right hands at the right time is a valuable asset for any business. However, interpreting and understanding this data is even more so. Due to the visual display of essential data such as charts, graphs and histograms, viewers can analyse trends swiftly and efficiently exercise the decision-making process.
To create accessible business dashboards
Real-Time Tracking
Business Dashboards are the face of other business intelligence components, including data management, sourcing, corporate performance management, etc. Information is presented in real-time; thus, positive and negative trends are immediately identified and instantly attended to.
Efficiency – Save time and effort with the right BI tool
Have you experienced the traditional method of tracking sales daily? The process requires hours of unnecessary work to gather information and make comparisons to previous sales figures. A business dashboard can readily provide this information at any given time. Business intelligence automates mundane tasks, thereby saving time and effort for improving management, studying trends, or increasing business performance.
Get Notified and Act Immediately
The best thing about business dashboards is they do not require 24/7 surveillance. Notifications, set on various data points, alert to specific problems. For example, a notification may be set to alert that a particular product has only 100 units left in the inventory or when the daily sales number goes below a specific value. The alert is issued immediately and immediately acted upon.
Types of Business Dashboards
Business dashboards are classified into three principal categories based on their functions.
Operational Business Dashboard
As per the name, operational business dashboards show the KPIs of the business operation. This assists in monitoring day-to-day operations, not to mention the entirety of the business operation. Due to consistent updating, operations are time-sensitive, and managers and decision-makers at all levels can view them frequently.
Strategic Business Dashboard
These dashboards present sales, customer acquisition, or product development strategies with assistance from critical milestones and goals. Strategic dashboards generally do not require real-time updating, as they exhibit long-term data used to analyse past strategies or assist with future strategies. Executives and managers use them to create strategic reports based on previous strategic information.
Analytical Business Dashboard
Analytical Dashboards are the most versatile of the three. They analyse unseen data. These dashboards allow users to compare, contrast, find trends, spot differences, and cross-verify with various data sets. Analytical dashboards are for any objective. However, they must display sufficient information and be flexible enough to conduct an analytical investigation which arrives at an effective strategy or decision. Mid-level managers and strategists generally use these databases.
In most cases, businesses may require a hybrid of all three business dashboard types. As such, investing in a tool which is only effective in one area is unwise. It may be necessary to ‘mix and match’ to find a business dashboard that works best for your business. Ensure the chosen tool is flexible enough to build the dashboard of your choice.
Which Business Dashboard Tool Should You Choose?
When choosing a dashboard tool, there are many factors to consider, such as the number of users, database sources you wish to link to, interior features and exportability. Luckily, business tool options are practically infinite.
For example, Tableau is an amazing data visualisation and dashboarding tool. However, it comes with a hefty price tag of around $100 per monthly user. Tableau has far more functionality than businesses are likely ever to use. As companies end up paying significant costs without using all the provided functionality, the value for money is decreased.
Alternative data visualisation and dashboarding tools such as Fourth Dimension cost just $1 per user monthly with no usage restrictions. Unlike other dashboarding tools, this database provides greater value as there is no excess functionality, and businesses will not pay for what they don’t use.